
Chemical Market Facts & Figures Infographic: 2023 Update
Our Chemical Market Facts & Figures Infographic 2023 Update gives you a visual representation of crucial data shaping the chemical industry. As we help companies in the liquid bulk and chemical supply chain, we like focusing on chemical market dynamics.
Chemical Market Facts & Figures Infographic review
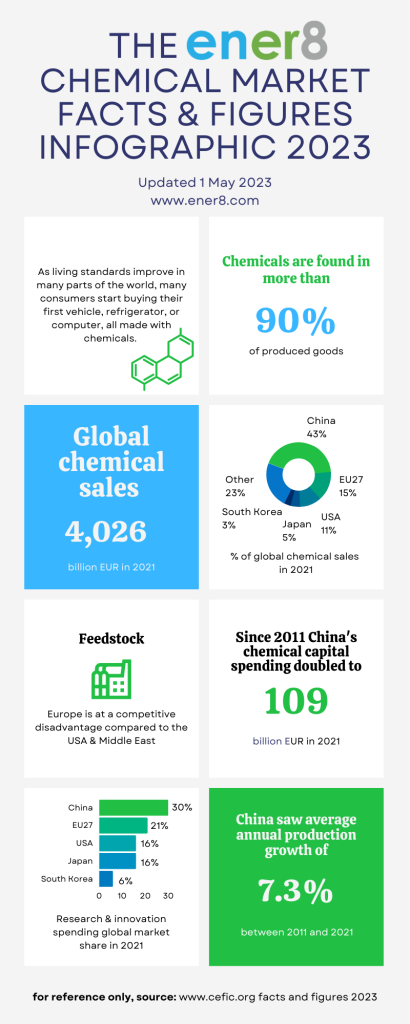
Chemicals are everywhere in everyone’s life and can be found in more than 90% of all produced goods. As living standards improve in many parts of the world, consumers start buying their first vehicle, refrigerator, or computer, all made with chemicals.
We sourced the data in our Infographic from the 2023 Facts And Figures Of The European Chemical Industry. Cefic, the European Chemical Industry Council, founded in 1972, is the voice of large, medium, and small chemical companies across Europe, which provide 1.2 million jobs and account for approximately about 15% of world chemicals production.
Sales of chemicals include petrochemicals, specialty chemicals, consumer chemicals, basic inorganics, and polymers. The industry uses these chemicals in rubber and plastics, construction materials, refined petroleum, textiles, paper, food products, motor vehicles, metals, electronics, machinery, and agriculture.
According to the report, China is the largest chemicals producer in the world, with EUR 1,729 billion in sales, or 43% of total world chemicals sales, which stands at EUR 4,026 billion. The European Union (EU27) is the second-largest chemicals producer in the world with EUR 594 billion in sales, followed by the USA with EUR 437 billion in sales. Japan and South Korea complete the top 5 in terms of chemical sales, with EUR 190 billion and EUR 133 billion in sales, respectively. During the last decade, China’s market share has increased dramatically, while the market share of the USA and Europe has dropped significantly.
Key emerging economies saw their average chemicals production grow faster than Europe and the USA, with the USA even shrinking. Regarding feedstock, it is also important to note that Europe is at a competitive disadvantage compared to the USA and the Middle East.
Between 2011 and 2021, China saw average annual production growth of 7.3%. This trend is confirmed if we look at global investment in chemicals, where China is leading in capital spending. The report shows that China’s 2021 chemicals capital spending stood at EUR 109 billion, almost double its 2011 chemicals capital spending. Research and innovation spending also increased in China, which is today, the largest R&I spender in the world with a market share of 30%. The European Union (EU27) is still the second largest R&I investor in the world, with a 21% market share, followed by the USA (16%), Japan (16%), and South Korea (6%).
Useful blog posts
You may also be interested in blog post 1 – Three Examples Exposing Complex And Vulnerable Supply Chains, and blog post 2 – Supply Chain Chokepoints: Why Are They A Threat to Trade?
Recommended Infographics
Energy Outlook Infographic: 2023 Update
Energy Transition Infographic: 2023 Update
Merchant Fleet Infographic: 2023 Update
Tank Container Infographic: 2023 Update
Tank Terminal Infographic: 2023 Update
Photo Credit: ener8